
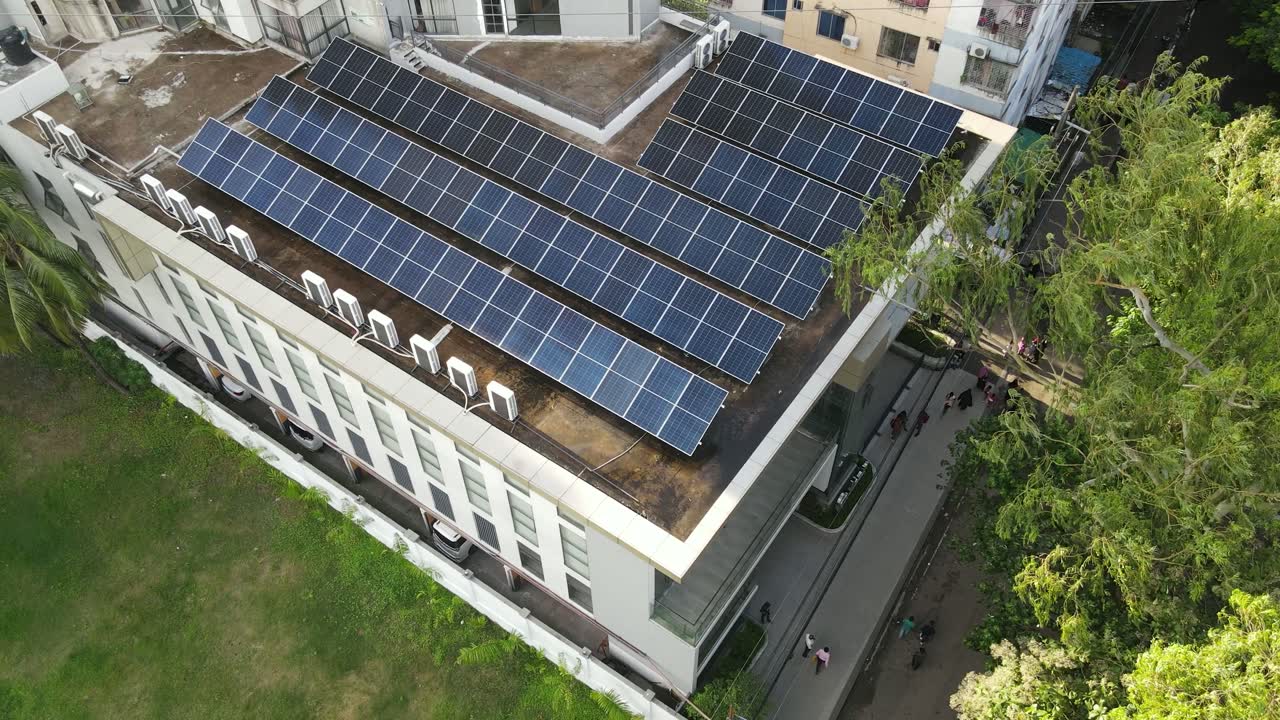
Decide si un proyecto solar es rentable, y preséntalo a tu cliente.
Para consultores e instaladores comerciales e industriales: generación esperada con datos de PVGIS, flujo de caja, VAN, TIR, payback y LCOE, escenarios lado a lado y un reporte listo para enviar. Sin rehacer el Excel en cada propuesta.
Por qué Voltperia
La generación es el comienzo. La decisión es financiera.
Tu cliente no compra kWh: compra un retorno. Voltperia une la estimación de generación con el análisis económico del proyecto, para que cada propuesta responda lo que el cliente pregunta: cuánto cuesta, cuándo se paga y qué pasa si cambian los supuestos.
VAN · TIR · LCOE
y payback simple y descontado, en cada escenario
Lado a lado
tamaños, inversiones y tarifas alternativas en una misma tabla
PDF + Excel
con tu marca y con el modelo financiero en fórmulas
El Excel exportado recalcula el flujo de caja con los mismos supuestos y da los mismos resultados que la plataforma.
Honesto sobre lo que calcula.
Voltperia calcula el valor de la energía generada con la tarifa y el autoconsumo que tú indicas, y lo dice así. El ahorro real depende de la curva de consumo, la estructura tarifaria y la compensación de excedentes: no lo inventamos cuando faltan esos datos.
Metodología
Datos públicos, un modelo verificable y supuestos a la vista.
La generación parte del año meteorológico típico de PVGIS, del Joint Research Centre de la Comisión Europea, con irradiancia transpuesta al plano de los módulos, pérdidas por ángulo de incidencia y el modelo de potencia de PVGIS. Frente a la calculadora oficial de PVGIS, en seis sitios de España, México y Argentina, el performance ratio difiere entre un 0,4 % y un 1,5 %. El modelo financiero es estándar y transparente: cada indicador se puede rastrear hasta su fórmula.
PVGIS
Joint Research Centre · Comisión Europea
Año meteorológico típico con irradiancia satelital (SARAH2, NSRDB) o reanálisis ERA5, según la región.
Modelo físico
El mismo que usa PVGIS
Transposición Hay-Davies, pérdidas por ángulo de incidencia y eficiencia de Huld con temperatura de módulo de Faiman.
Modelo financiero abierto
Trazable
Flujo de caja nominal con degradación y escaladas; VAN, TIR, payback y LCOE con fórmulas que puedes revisar en el Excel.
Cómo funciona
Del sitio a la propuesta, en minutos.
Ubica y dimensiona
Marca el sitio en el mapa e indica la potencia. Simulamos la generación de un año típico con datos de PVGIS.
Evalúa la economía
Carga inversión, O&M, tarifa y tasa de descuento. Ves el flujo de caja, el VAN, la TIR, el payback y el LCOE al instante.
Compara y presenta
Crea escenarios alternativos, mira qué supuesto pesa más y descarga el reporte para tu cliente en PDF o Excel.
El producto
Cada alternativa del proyecto, con sus números.
Para quién
Para quienes evalúan y venden proyectos solares.
Consultores de energía
Estudios de factibilidad consistentes y reutilizables, con supuestos explícitos y un reporte que no hay que maquetar.
Instaladores comerciales e industriales
Propuestas con payback, TIR y alternativas de tamaño en minutos, con tu marca, para cerrar antes.
Ingenierías y desarrolladores
Prefactibilidad rápida de sitios candidatos antes de encargar el estudio de detalle.
Precios
Empieza gratis. Pasa a un plan pago cuando las propuestas lleven tu marca.
Free
Evalúa tus primeros proyectos con el análisis completo.
- 3 proyectos con hasta 3 escenarios cada uno
- Generación esperada, flujo de caja, VAN, TIR, payback y LCOE
- Comparación de escenarios y sensibilidad
- Reporte PDF
Business
RecomendadoPara consultores e instaladores que presentan propuestas cada semana.
- Proyectos ilimitados. Todo tu historial de estudios, reutilizable.
- Reportes con tu marca. Tu logo, tu color y tus datos de contacto en el PDF y el Excel.
- Excel con fórmulas. El modelo financiero completo, editable.
- Hasta 10 escenarios por proyecto
- Hasta 10 usuarios en tu cuenta
- Monitoreo de instalaciones en operación (hasta 3)
Enterprise
Para equipos con un volumen alto de proyectos.
- Todo lo incluido en Business
- Hasta 25 escenarios por proyecto
- Hasta 20 usuarios en tu cuenta
- Monitoreo de instalaciones ilimitado, exportación CSV y emisiones de CO₂
Sin permanencia ni compromisos a largo plazo. Cancela cuando quieras.
Preguntas frecuentes
Antes de empezar
¿Qué necesito para el primer resultado?
La ubicación y la potencia del sistema. Con eso simulamos la generación y, con supuestos financieros de referencia, ya ves un flujo de caja. Esos supuestos quedan marcados hasta que cargas los del proyecto: inversión, O&M, tarifa y tasa de descuento.
¿Qué tan precisa es la generación?
Es una estimación P50 a partir del año meteorológico típico de PVGIS, con el mismo modelo de potencia que PVGIS: frente a su calculadora oficial, el performance ratio difiere entre un 0,4 % y un 1,5 %. Un año concreto puede quedar algo por encima o por debajo, y el modelo no conoce sombras cercanas ni recortes del inversor.
¿Calculan el ahorro en la factura?
No, y lo decimos explícitamente. Calculamos el valor de la energía generada con la tarifa, el autoconsumo y el precio de excedentes que indicas. El ahorro real exige la curva de consumo del cliente, la estructura tarifaria completa y el régimen de compensación.
¿Puedo seguir trabajando en Excel?
Sí, en los planes pagos. El Excel exportado trae cada escenario con los supuestos en celdas editables y el flujo de caja, VAN, TIR, payback y LCOE en fórmulas: cambias un supuesto y todo se recalcula.
¿Cubre mi país?
Prácticamente cualquier punto en tierra firme: PVGIS tiene cobertura global. Los montos se cargan en la moneda del proyecto (USD, EUR, MXN, BRL, CLP, COP y otras).
¿Mis datos son privados?
Sí. Solo tu cuenta puede ver tus proyectos; no los compartimos ni los vendemos. Puedes borrar tu cuenta y todos sus datos desde Configuración.
¿Puedo cancelar cuando quiera?
Sí. Los planes son mensuales y sin permanencia. Cancelas desde Facturación y conservas el plan hasta el final del período pagado; después, la cuenta pasa al plan Free sin perder tus proyectos.
¿Es rentable tu próximo proyecto?
Empieza por la generación esperada: ubicación y potencia, sin registro.
Calcular gratis